RS485 Commander is a Windows desktop application for commissioning, testing and monitoring industrial devices over Modbus RTU, ASCII, and TCP/IP networks. It connects to any Modbus slave device via a USB-to-RS485 adapter or Ethernet connection, and provides a full suite of tools organized in six main tabs:
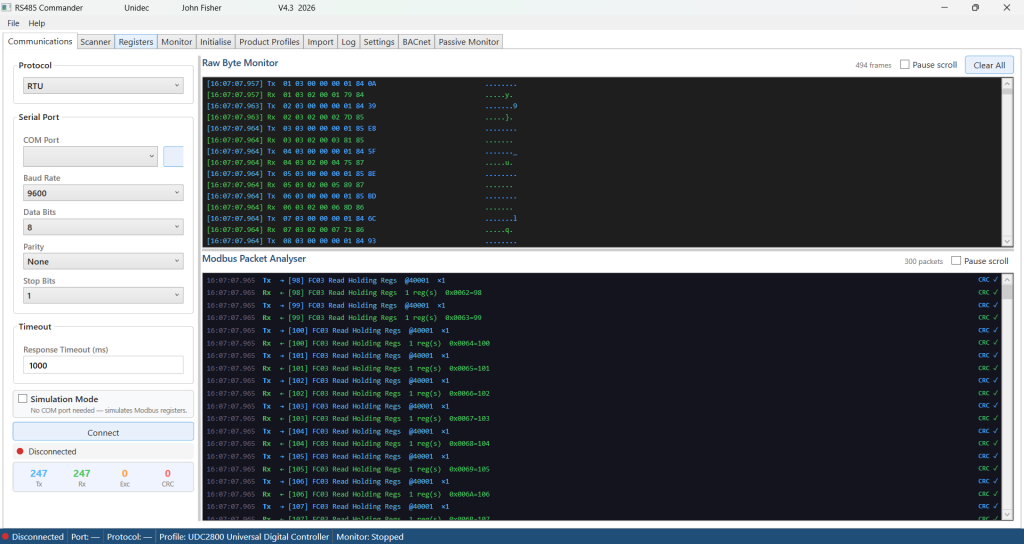
- Communications setup with a live packet analyzer
- Automatic bus scanner
- Register read/write/log tool with real-time graphing
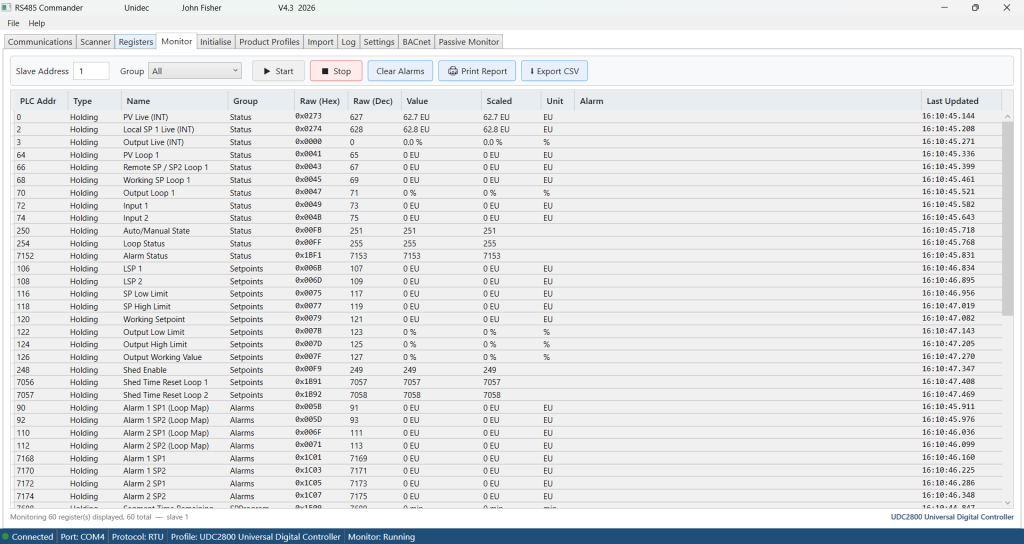
- Monitoring dashboard with alarm thresholds
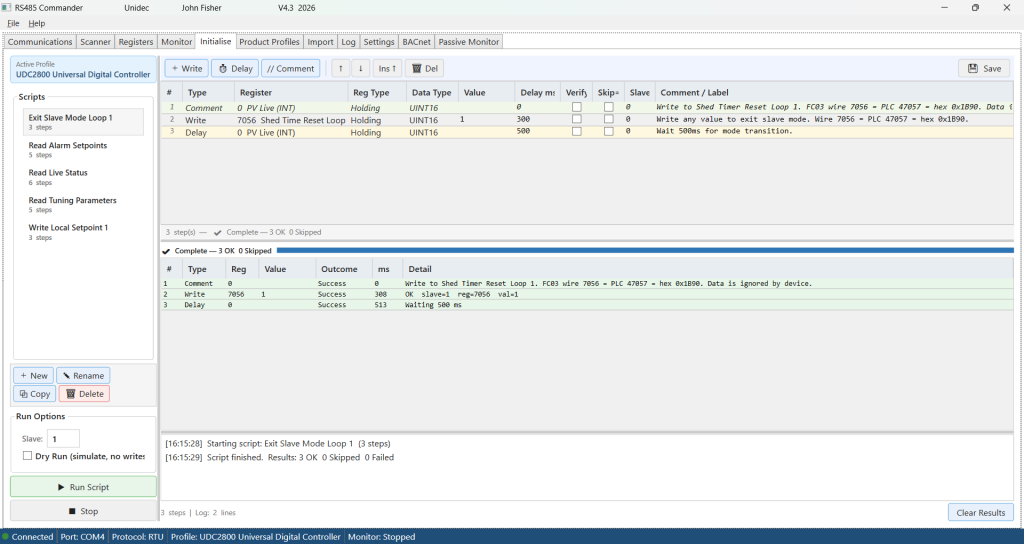
- Initialization engine for applying repeatable commissioning and test sequences to a device in one click.
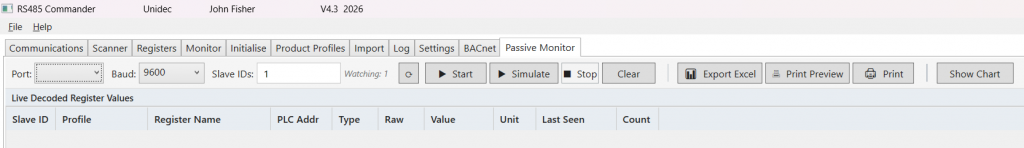
- Passive monitor to monitor traffic on the Modbus, displays, graphs and reports on devices by address, register read/writes, etc.

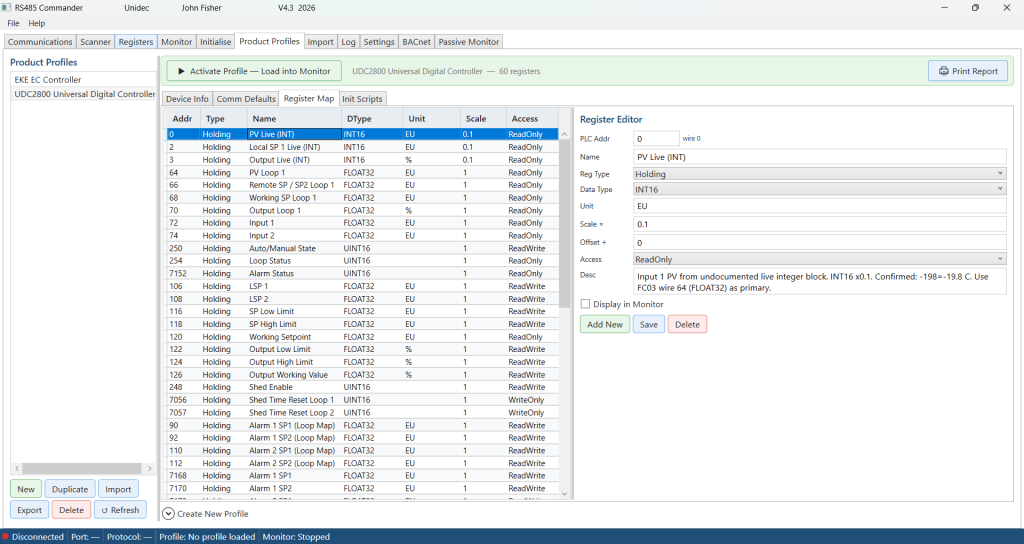
At the heart of the application is a device profile system. Each product profile is a self-contained SQLite database file that stores a device’s complete register map — including names, data types, scale factors, engineering units, named value mappings, alarm conditions, group poll rates, and commissioning scripts.
A profile Import tool allows importing of register definitions taken directly from the manufacturer’s user or Modbus manual manual. Profiles can be built from scratch or by importing a device definition file in CSV, JSON, XML, or Excel format, with a built-in pre-flight analysis engine that validates the data and highlights errors before anything is written to disk.
Profiles can be created using AI by providing our template and the manufacturer’s manual – this is a great approach.
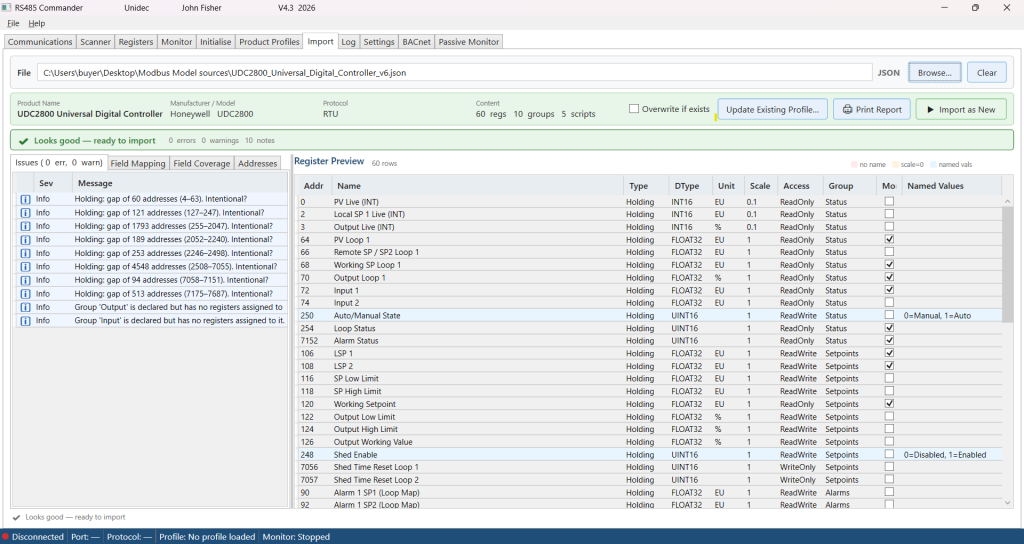
Once created, profiles are portable — copy a .db file to another PC running RS485 Commander and the full device definition travels with it.
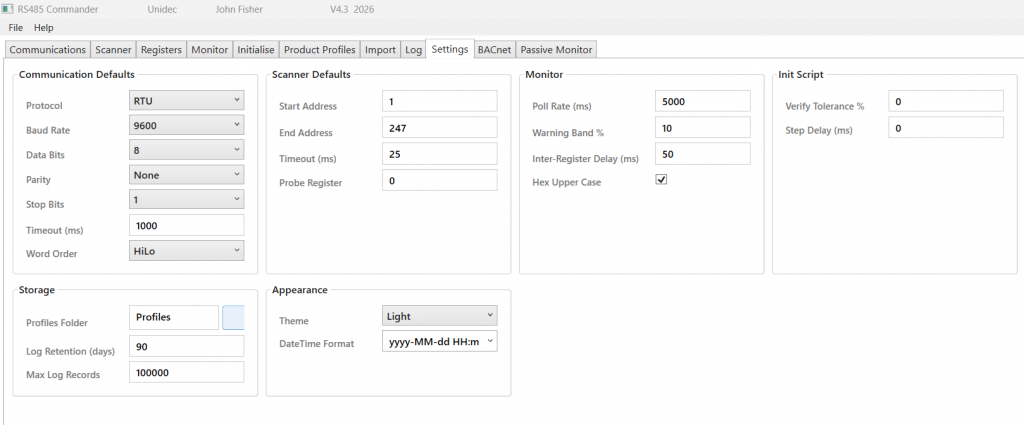
RS485 Commander is designed for the workflow of a field commissioning engineer. The scanner discovers unknown device addresses automatically. Double-clicking a scan result pushes the slave address to every other tab simultaneously and assigns the active profile to that device. The monitor tab polls all flagged registers continuously and raises visual alarms the moment a threshold is breached. Every session, scan, register transaction, and script execution is logged to a persistent database for after-the-fact review. Settings — including default COM port, baud rate, and slave address — are saved automatically on every successful connection so the tool is always ready to go on the next visit to a site.
Initialization scripts for each profile can be created to initialize the Modbus device, pre-load user parameters and settings for testing and provisioning.
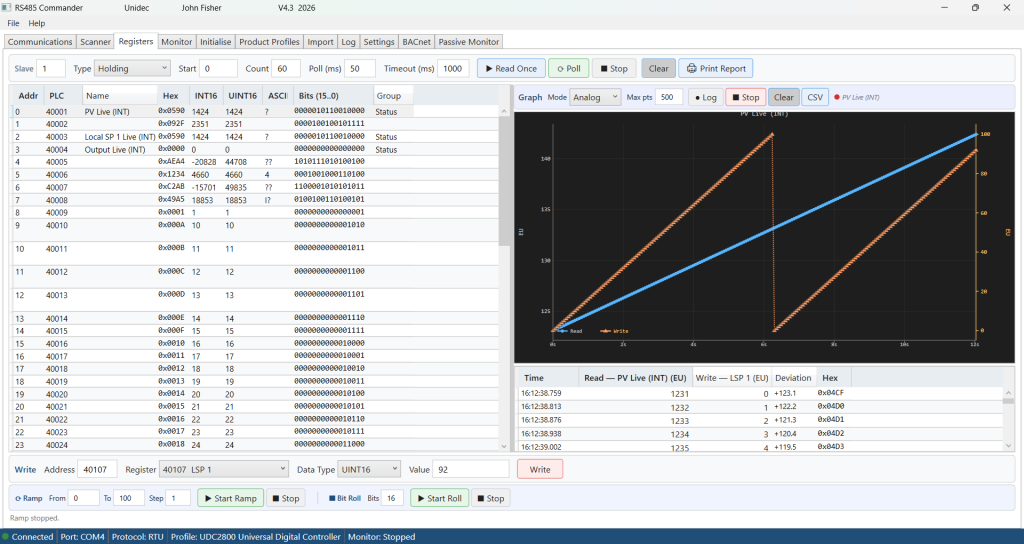
When it comes to troubleshooting a misbehaving device, RS485 Commander goes well beyond simple register reads. The Registers tab lets you read individual registers on demand or continuously poll them at a configured rate, and simultaneously write a setpoint value to a second register while the read is in progress. Both values are plotted in real time on a dual-axis graph — the read value on the primary axis and the written setpoint on the secondary — so the relationship between a command and a response is immediately visible. A deviation trace shows the difference between the two, making it straightforward to spot whether a drive is tracking its speed reference, a valve is reaching its commanded position, or a PID loop is settling correctly. The entire session is captured in a timestamped log table showing raw hex, decoded values, written setpoints, and deviation at every sample point, and can be exported to CSV or printed as a formal report.
Combined with the Communications tab’s packet analyzer — which decodes every Modbus frame on the wire, validates CRC checksums in real time, and flags protocol errors — engineers have a complete picture of both the application-level behavior and the raw bus traffic simultaneously.
Monitoring Modbus registers is easy with the monitor tab. All or grouped device registers can be polled and read and then a summary and register report can be printed or printed to PDF. The data may also be exported as a comma-delimited csv file for importing into excel directly.
The Passive monitor tab monitors traffic on the connected Modbus. It displays, graphs and reports on Modbus devices by address, register read/writes, etc. Once a profile is loaded, the monitor is able to decode and display scaled values with units.
A complete pdf user manual and built-in context sensitive help system is included in this tool.
Buy it here https://unidec.com/product/rs485commander